ROI Nose Rings Virtual Try On: How Link‑Based VTO Boosts Conversion, AOV and Cuts Returns
Quick Summary
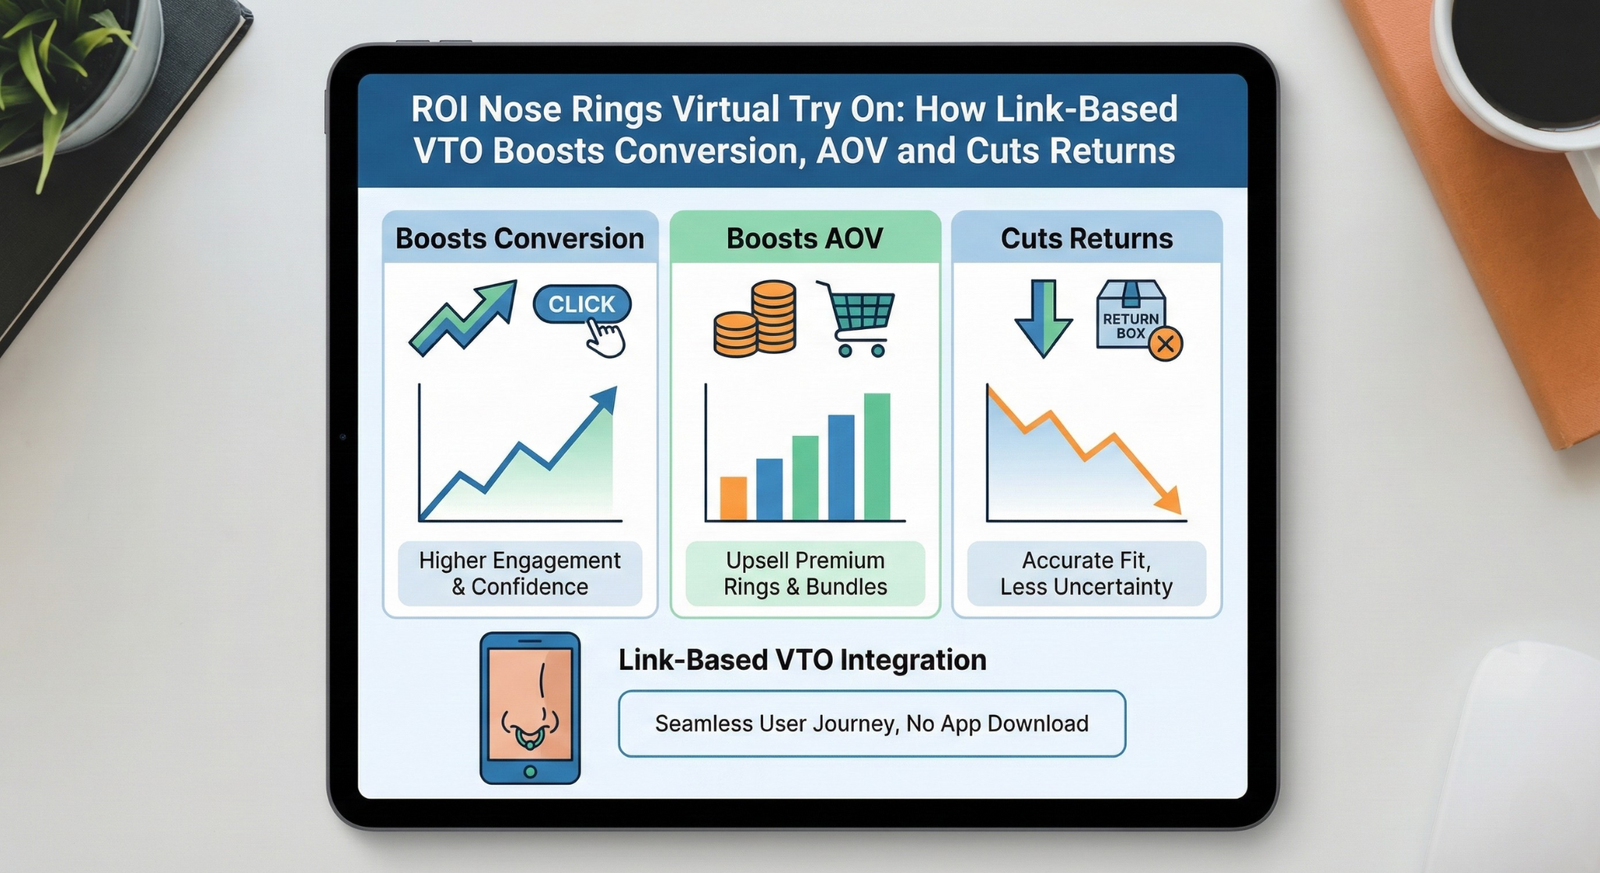
- Link‑based virtual try‑on (VTO) for nose rings is a low‑friction experiment that increases purchase confidence, uplifts conversion and reduces returns.
- Measure core KPIs: VTO take‑rate, try‑on conversion rate, overall conversion uplift, AOV uplift and returns reduction—use the three‑scenario ROI model to forecast impact.
- Deploy quickly with no SDK: tryitonme.com delivers shareable links for fast testing across product pages, email, SMS and ads.
- Returns reduction often supplies the largest part of VTO ROI by recovering margin and lowering handling costs.
Introduction — why roi nose rings virtual try on matters
roi nose rings virtual try on is one of the fastest, lowest‑risk experiments you can run to lift sales and cut return costs for facial jewelry. Nose rings are small, highly visual items where shoppers face scale and placement uncertainty; offering an in‑browser try‑on removes that hesitation and increases purchase confidence. For context on how facial accessory AR reduces visual uncertainty and drives shopper engagement, see PerfectCorp’s overview of nose‑piercing filters.
In this post you’ll get a testable commercial playbook: the core KPIs (try on conversion rate and more), a transparent “virtual try on roi” calculation with conservative/moderate/optimistic scenarios you can copy, a 4–6 week A/B test plan, an implementation checklist to run a pilot in days using tryitonme.com, and practical UX and measurement tips to maximize results. All numeric examples are illustrative—plug your brand’s traffic, AOV and return costs for precise forecasts.
The Business Case — Why Nose Rings (and Small Accessories) are a Great Fit for VTO
Visual uncertainty drives hesitation
Shoppers struggle to judge how studs, hoops or septum rings will look on their face from product photos alone. AR try‑on reduces that uncertainty by showing scale and placement in context, which shortens the path from browse to buy. See PerfectCorp’s discussion of facial‑accessory AR.
Low friction to try increases engagement
Nose rings are quick to test — a one‑tap selfie or camera preview is all it takes. That low interaction cost drives higher VTO take‑rates versus more complex items, so more shoppers actually experience the product on themselves before buying.
High margin and repeat potential
Nose jewelry typically carries healthy gross margins and lends itself to add‑ons (multiple studs, pairing suggestions). That means small percentage uplifts in conversion or AOV can compound into meaningful incremental profit over time. See an implementation overview at cermin.id.
Core KPIs to Measure Success
- try on conversion rate — percentage of users who use the VTO and then purchase (VTO users → purchase).
- Overall conversion uplift — change in conversion rate for product pages with the VTO vs. control pages.
- returns reduction try on — delta in return rate for orders where the VTO was used versus baseline returns for the same SKUs.
- AOV uplift — added order value from upgrades or cross‑sells after using VTO.
- LTV / repeat uplift — longer‑term repeat purchases driven by better purchase confidence. For background on VTO outcomes and commerce impact, see Fytted’s overview.
How Link‑Based VTO Works — Quick Technical & Operational Overview
virtual try on roi is easiest to test when implementation friction is low. tryitonme.com delivers a shareable, ready‑to‑use product link (not an SDK or embedded script) that launches the VTO experience in a browser on desktop or mobile. Because it’s link‑based:
- No SDK/API or heavy engineering is required — marketing or merch teams can deploy links across product pages, emails, SMS, social ads and influencer CTAs.
- The same link works across channels and devices, simplifying tracking and campaign attribution.
- The onboarding is simple and fast:
- You purchase a 6‑month package for the SKUs you want to test. Pricing & packaging.
- You send standard product photos (e.g., closeups and scale references).
- The tryitonme.com team and/or AI handle AR processing.
- You receive a unique, ready‑to‑use try‑on link for deployment in under 3 business days (per tryitonme.com).
This approach removes engineering gates, so you can run A/B tests and iterate creative quickly.
Quantifying ROI — Transparent Model & 3 Scenarios (virtual try on roi)
This section provides an illustrative “virtual try on roi” model and three ready‑to‑use scenarios. Label this box “illustrative example — plug in your numbers.” For conceptual support on VTO impact, see Fytted and for browser VTO mechanics see Glamar. The text also includes the primary SEO phrase roi nose rings virtual try on.
Illustrative baseline inputs (example)
- Monthly visitors to SKU or product cluster: 10,000
- Baseline conversion rate: 1.5%
- AOV: $45
- Gross margin: 60%
- Baseline returns rate: 8%
- VTO take‑rate (users who try VTO when offered): 20–35%
- Conversion lift among VTO users: +20% (conservative) to +60% (optimistic)
- Returns reduction try on: −15% (conservative) to −40% (optimistic)
How to compute (step by step)
- Baseline orders = visitors × baseline conversion.
- VTO users = visitors × VTO take‑rate.
- Incremental conversions = VTO users × (VTO_user_conv − baseline_conv).
- Incremental revenue = incremental conversions × AOV.
- Adjust incremental revenue for reduced returns (apply returns reduction try on to incremental orders).
- Incremental gross profit = net incremental revenue × gross margin.
- Subtract monthly VTO costs to compute payback and ROI.
Three Example Scenarios (illustrative math for roi nose rings virtual try on)
Using the common input set above — visitors = 10,000; baseline conv = 1.5%; AOV = $45; margin = 60%; baseline returns = 8%:
Conservative
- VTO take‑rate: 20% → VTO users = 2,000.
- VTO user conv = 1.5% × 1.20 = 1.8%.
- Incremental conversions = 2,000 × (1.8% − 1.5%) = 6 orders.
- Incremental revenue = 6 × $45 = $270.
- Returns reduction try on: −15% → incremental orders return rate = 8% × 0.85 = 6.8%.
- Net incremental revenue after returns ≈ $270 × (1 − 0.068) = $252.
- Incremental gross profit = $252 × 0.60 = $151.
Moderate
- VTO take‑rate: 28% → VTO users = 2,800.
- VTO user conv = 1.5% × 1.35 = 2.025%.
- Incremental conversions = 2,800 × (2.025% − 1.5%) = 15.3 ≈ 15 orders.
- Incremental revenue = 15 × $45 = $675.
- Returns reduction try on: −25% → returns ≈ 6%. Net incremental revenue ≈ $675 × (1 − 0.06) = $635.
- Incremental gross profit = $635 × 0.60 = $381.
Optimistic
- VTO take‑rate: 35% → VTO users = 3,500.
- VTO user conv = 1.5% × 1.60 = 2.4%.
- Incremental conversions = 3,500 × (2.4% − 1.5%) = 31.5 ≈ 32 orders.
- Incremental revenue = 32 × $45 = $1,440.
- Returns reduction try on: −40% → returns ≈ 4.8%. Net incremental revenue ≈ $1,440 × (1 − 0.048) = $1,369.
- Incremental gross profit = $1,369 × 0.60 = $821.
Notes on the model
These are illustrative—label them “illustrative example — plug in your numbers.” Add any VTO subscription or creative costs to determine true payback. If you want, we can prepopulate a downloadable spreadsheet with these scenarios and your brand inputs.
How Returns Reduction Drives the Largest Part of ROI
returns reduction try on matters because prevented returns recover margin and reduce handling costs. VTO aligns expectations (scale/placement), lowering dissatisfaction and return requests; industry overviews identify return reduction as a major immediate driver of VTO ROI — see Fytted and facial AR context at PerfectCorp.
Operationally, fewer returns also reduce customer service time, inbound shipping and restock labor—include your per‑return handling estimate (e.g., $5–$12) for a fuller ROI. Ask your analytics team for per‑return cost to compute total savings precisely.
Improving Try‑On Conversion Rate — UX & Marketing Best Practices
try on conversion rate increases when VTO is visible, trusted and easy to use. Quick checklist:
- CTA copy & placement: “Try this nose ring on” next to product title and add‑to‑cart. Test sticky mobile CTAs.
- Visual previews: short demo GIFs showing the try flow or before/after thumbnails.
- Social & acquisition: use the same shareable try link in Instagram/TikTok ads, email and SMS to drive traffic directly into the try flow.
- Incentives & social proof: “Save and share your look” or quick discounts for first‑time tryers can boost usage.
- Product-level UX: allow nostril left/right and septum placement options; recommend pairings to increase AOV. See placement guidance at cermin.id.
- Tracking events: instrument VTO opened, VTO completed, add‑to‑cart post‑VTO, and purchase with VTO flag.
A/B Test & Measurement Plan (run within 4–6 weeks)
Design
- A (control): product page without VTO link.
- B (treatment): product page with tryitonme.com link/CTA.
Hypothesis
The VTO link will increase product conversion rate and reduce returns for orders where the VTO is used.
Primary metric
Change in product‑level conversion rate.
Secondary metrics
try on conversion rate (VTO users → purchase), add‑to‑cart rate, AOV, returns rate by cohort.
Sample size & duration
With a low baseline conversion (e.g., 1.5%) you typically need several thousand visitors per variant to detect modest lifts. Use an online sample‑size calculator to input your baseline conversion and desired minimum detectable effect. Run the test 4–6 weeks to capture return windows and traffic variance.
Attribution & tracking tips
Tag all links with UTMs to identify channel and campaign. Include an order‑level flag or coupon for purchases where VTO was used when possible. For tryitonme.com link attribution guidance and demo, see tryitonme.com. Additional analytics notes at cermin.id.
Recommended Event Map for Tracking
- vto_link_viewed (when the try link is opened)
- vto_try_completed (user finishes placement/view)
- vto_add_to_cart (add after try)
- vto_purchase_flag (order flagged as VTO used)
- return_flag (to segment returns by VTO usage)
Implementation Checklist & Timeline (pilot launch in days)
virtual try on roi — quick pilot checklist
- Gather product assets (high‑quality images and scale references). Asset guidance.
- Purchase the 6‑month package for test SKUs and send assets to tryitonme.com.
- Receive shareable try links in under 3 business days (tryitonme.com).
- Add links/CTAs to product pages, emails, SMS and social ads. Deployment tips.
- Configure UTMs and analytics events.
- QA across devices and launch.
Suggested timeline
- Day 0–2: gather assets and request tryitonme.com links.
- Day 3–7: deploy links on pages and campaigns, QA.
- Week 1: launch pilot traffic.
- Weeks 2–6: run A/B test, monitor conversion/AOV/returns.
- Week 6+: analyze and decide scale/rollout.
Case Study Ideas, Visuals & Asset Suggestions
returns reduction try on — assets to collect for the post and for merchant reporting:
- Conversion uplift bar chart (baseline vs. VTO).
- Returns before/after table (VTO users vs. non‑users).
- Revenue waterfall: gross revenue → returns → net revenue → gross profit.
- Mobile & desktop screenshots of the tryitonme.com flow (selfie capture, placement UI, share/save).
- Nose ring images: closeups, diverse skin tones, left/right/septum placements, scale overlays.
FAQs
Will it slow my site?
No — link‑based VTO loads the experience from the shareable link instead of embedding heavy scripts on your page, so page performance impact is minimal.
How accurate is fit?
Accuracy depends on product assets and calibration. tryitonme.com uses face alignment and scale calibration; iterate assets for better realism. See face alignment context at PerfectCorp.
What about privacy and camera access?
Camera access is client‑side and permission‑based. Ask tryitonme.com for their privacy policy and data handling details before launch.
Will results vary by SKU?
Yes—pilot across representative SKUs to capture variance. Different shapes, finishes and price points can change try‑on appeal and return behavior.
How quickly can I see ROI?
You can deploy links in days and run a meaningful 4–6 week test for conversion and early returns signals; full ROI may require adding per‑return cost estimates and subscription fees.
Why tryitonme.com is the Right Fit for Your Business
- Zero‑code, link‑based deployment — no SDK or API work required; marketing can deploy links. (tryitonme.com)
- Fast time‑to‑market — unique, ready‑to‑use try‑on link delivered in under 3 business days. (tryitonme.com)
- Accurate accessory VTO — focused AR processing for small facial jewelry to improve alignment and scale realism. See comparison notes at cermin.id.
- Channel flexible — same link for product pages, email, SMS and social ads, simplifying tracking and campaign reuse.
Book a Demo
Run this ROI with your numbers — request a pilot link and start a no‑code VTO pilot for your nose rings today: https://tryitonme.com?utm_source=blog&utm_medium=content&utm_campaign=nr_vto_pilot
Calls to Action & Next Steps
- Mid‑article CTA: Run this ROI with your numbers — request a pilot link: tryitonme.com pilot
- End CTA: Launch a no‑code VTO pilot for your nose rings today on tryitonme.com
SEO & On‑Page Elements
Suggested meta title: ROI Nose Rings Virtual Try On — How Link‑Based VTO Boosts Conversion, AOV & Cuts Returns
Suggested meta description: Calculate virtual try on roi for nose rings with our three‑scenario model, A/B test plan, and a no‑code pilot using tryitonme.com shareable links.
Assets & Inputs Needed from Stakeholders
- Baseline analytics for representative nose‑ring SKUs (monthly visitors, conv, AOV, returns).
- tryitonme.com pricing or pilot cost to compute payback.
- High‑quality product and model images (diverse skin tones, multiple placements).
- Merchant quotes or case results (if available).
Deliverables for Publishing
- 1,400–2,200 word post with keyword placement as above.
- Downloadable ROI spreadsheet prefilled with conservative/moderate/optimistic scenarios.
- 3–5 visuals (conversion chart, returns table, revenue waterfall, mobile/desktop screenshots) with captions.
- Meta description and 3 social blurbs.
Success Criteria & Publishing Checklist
- Primary keyword present in title + first paragraph.
- All required keywords placed in their sections.
- UTM’d demo CTA(s) pointing to https://tryitonme.com.
- Attach ROI spreadsheet and visuals.
- Structured data and tracking for demo CTA conversions.
Appendix — Research Sources & Citations
Next step — what would you like me to do now?
I can (pick one):
- Deliver the downloadable ROI spreadsheet prefilled with the three scenarios so your analytics team can plug in actual metrics;
- Create the 3 visual mockups (conversion bar chart, returns table, revenue waterfall) with captions for publication; or
- Iterate this draft with your brand inputs (your SKU traffic, AOV, returns and tryitonme.com pricing) and produce the final publishable post and assets.
Which deliverable should I produce next?