
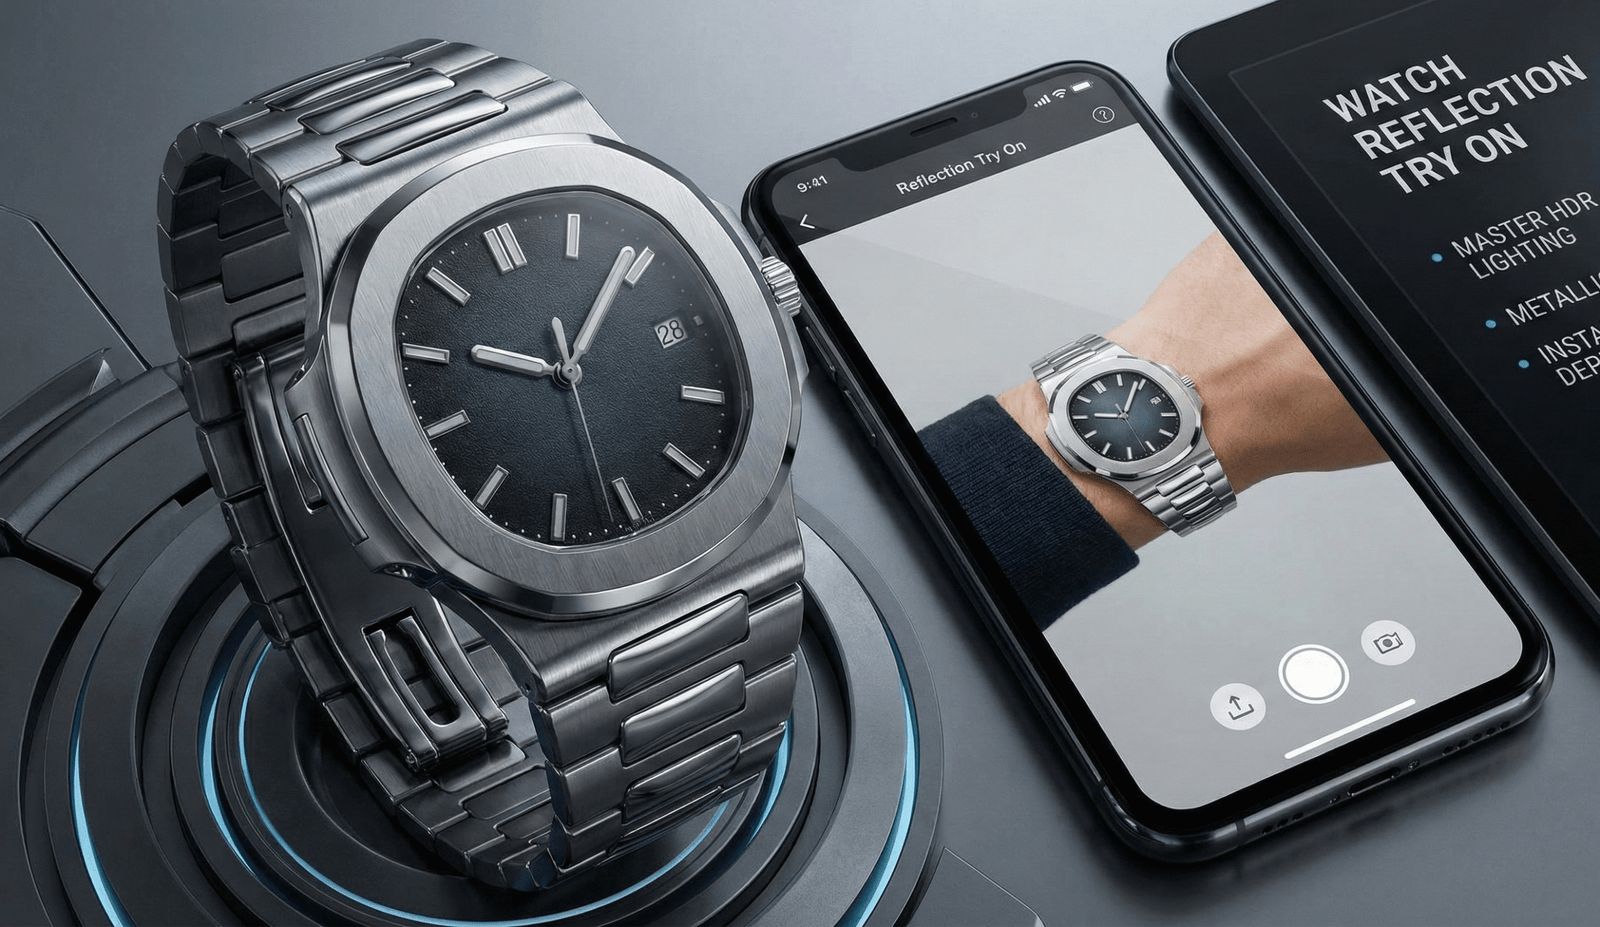
ROI Men’s Watches Virtual Try On: How Link-Based VTO Boosts Conversion, AOV & Cuts Returns
roi men’s watches virtual try on in one line — ROI men’s watches virtual try on is a fast, measurable way to cut shopper hesitation and unlock more profitable online sales for watch brands.
- Link-based, zero-code VTO reduces wrist-fit uncertainty and styling doubt to lift PDP conversion.
- Measure try-on conversion, PDP conversion, AOV, and returns reduction together to calculate net ROI.
- Tryitonme.com offers fast, link-based deployment (shareable links, no SDK) and full-service asset processing.
- Run a 4–6 week A/B pilot on top SKUs, instrument try-on events, and use the ROI calculator to plan payback.
Quick problem summary
Fit/size ambiguity, perceived product quality, and “not as expected” returns create hidden costs and low conversion performance. Read on for a data-driven playbook that helps CROs, e‑commerce managers, and merchandising leads run a fast pilot.
The challenge for men’s watch e‑commerce
- Fit uncertainty: shoppers can’t easily judge case diameter and lug-to-lug proportions on their wrist.
- Style doubt: will the strap/finish match outfits or occasion?
- Trust: high-consideration buyers worry a premium image might not translate to reality.
- Returns cost: expectation mismatch drives returns that erode margin.
What is virtual try on and why it matters for watches
Virtual try on (VTO) is an augmented reality/visualization layer that lets shoppers see a product in context before buying. For watches, the priority is wrist realism: case size relative to wrist, strap look and texture, and how the watch sits with sleeve/skin tone.
How watch VTO is distinct
- Eyewear VTO prioritizes face-shape and frame fit.
- Jewelry VTO focuses on ornament placement and scale.
- Watch VTO emphasizes wrist proportion, case diameter, and strap/band realism.
Better visualization raises shopper confidence and decision quality, which can translate to higher conversions and fewer expectation-driven returns. See Shopify’s overview of 3D models and AR for merchants for context: shopify.com/partners/blog/3d-models-ar. Vendor case studies (Snap, Perfect Corp) also document engagement and conversion gains: forbusiness.snapchat.com, perfectcorp.com.
Why tryitonme.com is the Right Fit for Your Business
- Zero-code, link-based deployment: launch product try-ons via a simple shareable link — see product/demo: tryitonme.com.
- Fast time-to-market: unique try-on links delivered in under 3 business days from standard product photos — onboarding: tryitonme.com.
- Full-service AR processing: brands send standard photos; tryitonme.com’s team/AI handles asset processing and calibration.
- Multi-channel links work across web PDPs, mobile, email, SMS, paid social, and influencer content.
- Built to drive higher try-on engagement and measurable PDP conversion lift.
How VTO drives revenue: the key metrics
Core KPIs to measure and where they move:
- Try-on conversion rate: try-on starts / PDP sessions.
- PDP conversion rate: sessions → purchases (use Google Analytics definitions).
- AOV: track upsell to higher-priced models or accessories after VTO exposure.
- Returns reduction: reduced “not as expected” returns save direct cost and operational overhead — see Narvar returns research.
- Engagement/time-on-page: VTO users typically spend more time engaging; see analytics vendors like Contentsquare.
Proof & benchmarks
Market resources and vendor-reported case studies provide context but vary by setup and traffic intent:
- Shopify merchant success stories and AR uplift potential: shopify.com/partners/blog/3d-models-ar.
- Vendor case examples from Snap and Perfect Corp: forbusiness.snapchat.com, perfectcorp.com.
- Returns volume and merchant impact context: narvar.com.
- Platform comparisons and watch-specific UX: tryitonme watches vs Wanna.
- Related ROI playbook for women’s watches: ROI women’s watches virtual try on.
Vendor-reported uplifts are indicative; run a pilot for precise percent lifts on your traffic and SKUs.
Calculating ROI for men’s watches virtual try on
Inputs you need: monthly PDP traffic, baseline conversion rate, AOV, gross margin per order, return rate and cost per return, implementation and operating cost. Narvar provides returns context: narvar.com.
Formula templates:
- Incremental revenue = Traffic × Baseline conversion × Conversion uplift × AOV
- Returns savings = Orders × Baseline return rate × Return reduction × Cost per return
- ROI = (Incremental gross profit + Returns savings) / Implementation cost
Worked example (illustrative)
- Traffic: 50,000 PDP visits/month
- Baseline conversion: 1.8%
- AOV: $240
- Gross margin: 60%
- Return rate: 8%
- Cost per return: $18
- Conversion lift from VTO: 30%
- Return reduction: 20%
- Annual implementation cost: $18,000
Results (illustrative):
- Baseline orders: 900 orders/mo
- Incremental orders: 270 orders/mo
- Incremental revenue: $64,800/mo
- Incremental gross profit: $38,880/mo
- Annual gross uplift: $466,560
- Annual returns savings (illustrative): ~$3,108
- Annual benefit: ~$469,668 → ROI ≈ 26x on $18k cost
All percentages and costs above are examples — run the plug-and-play calculator with your numbers: Calculate your ROI.
Plug-and-play ROI calculator
Fields to fill: traffic, baseline conversion, lift %, AOV, margin, return rate, cost per return, implementation cost. Embed near the top of the article and again in the CTA block: tryitonme.com.
Real-world use cases / mini case studies
Hypothetical case study (clearly labeled)
- Brand: DTC automatic watch maker (hypothetical)
- Problem: good traffic, low conversion, returns citing “didn’t look right”
- Solution: tryitonme.com link-based VTO on PDP and paid social landing pages
- Results (hypothetical): try-on engagement 28%, PDP conversion +24%, AOV +11%, returns -18%, time to launch 3 days
Real vendor-reported case studies and demos: tryitonme.com, shopify.com, forbusiness.snapchat.com, perfectcorp.com.
Implementation & launch plan (no-code advantage)
- Select high-traffic SKUs (top 10–20).
- Send standard product photos to tryitonme.com.
- Receive shareable product try-on links in under 3 business days.
- Add links to PDPs, collection pages, email, SMS, and paid social.
- Run a 4–6 week A/B test, measure KPIs, and scale winners.
Platform-specific PDP/button guidance: Watches Try On Shopify guide, UX playbook.
Link-based vs SDK/API comparison
- Time to launch: Link-based — Fast; SDK/API — Slower.
- Dev resources: Link-based — Minimal; SDK/API — Significant.
- Channels supported: Link-based — Web, mobile, social, SMS, email; SDK/API — Depends on integration.
- Instant updates: Link-based — Yes; SDK/API — Sometimes requires redeploy.
- Best for rapid pilots: Link-based recommended.
Best practices for optimizing try on conversion rate for men’s watches
- Creative: include lifestyle wrist shots, wrist-size reference markers, and strap/material close-ups.
- UX: Make the Try On CTA prominent; reduce steps to start; optimize for mobile-first.
- Messaging: emphasize “See size on your wrist” and “Works in browser — no app.”
- Analytics: track link clicks, try-on starts/completes, add-to-cart after try-on, purchases, returns (Google Analytics naming guidance).
- Testing: A/B test CTA placement and thumbnail variants (see A/B checklist).
- Asset quality: better photos → better AR realism (vendor guidance from Perfect Corp).
Reducing returns with try on
VTO aligns expectations (visual confirmation), increases fit confidence, and reduces “didn’t look like the photo” returns. Narvar details how returns impact merchant economics: narvar.com.
Operational tips
- Post-purchase feedback prompts to capture “fit” reasons.
- Segment returns by reason to quantify the VTO effect.
- Use re-engagement and styling content post-purchase to reduce remorse returns.
A/B test checklist & KPI tracking plan
Test design essentials:
- Test high-traffic SKUs for 4–6 weeks; follow sample-size and MDE guidance from ConversionXL.
- Events to instrument: PDP sessions, try-on link clicks, try-on starts, try-on completes, add-to-cart after try-on, purchases, return events.
- Segment by price band, strap type, case size, and traffic source.
- Report weekly and conclude when statistical confidence is reached.
Pricing & costs
Think in terms of “cost vs incremental profit unlocked.” Costs include subscription/package (tryitonme.com follows a 6‑month package model — see pricing/contact: tryitonme.com), asset prep, and optimization hours. For watch-specific pricing guidance: Men’s Watches Virtual Try On Pricing.
FAQs
- Is VTO private and secure?
- Yes — standard link-based experiences avoid heavy integration; review data and consent needs per your privacy team and guidance such as the ICO: ico.org.uk.
- Will VTO work on mobile?
- Yes — mobile-first experiences are supported and critical for social/SMS traffic.
- Do we need developers?
- No — link-based, zero-code deployment requires minimal developer effort.
- How accurate is watch VTO?
- Accuracy depends on asset quality and calibration; better product photos and metadata improve realism.
- How long to launch a pilot?
- Typical time-to-first-link is under 3 business days from standard product photos with tryitonme.com.
Conclusion & next steps
For men’s watch merchants, link-based virtual try on can improve try-on engagement, lift PDP conversions and AOV, and help reduce returns — creating strong virtual try on ROI when measured end-to-end.
Primary CTA (hero/top): Try a demo link
Secondary CTA (mid/post): Calculate your ROI / Request a tailored assessment
Ready to see a product link for a single SKU in 3 business days? Request a demo or run your numbers in the ROI calculator: tryitonme.com.