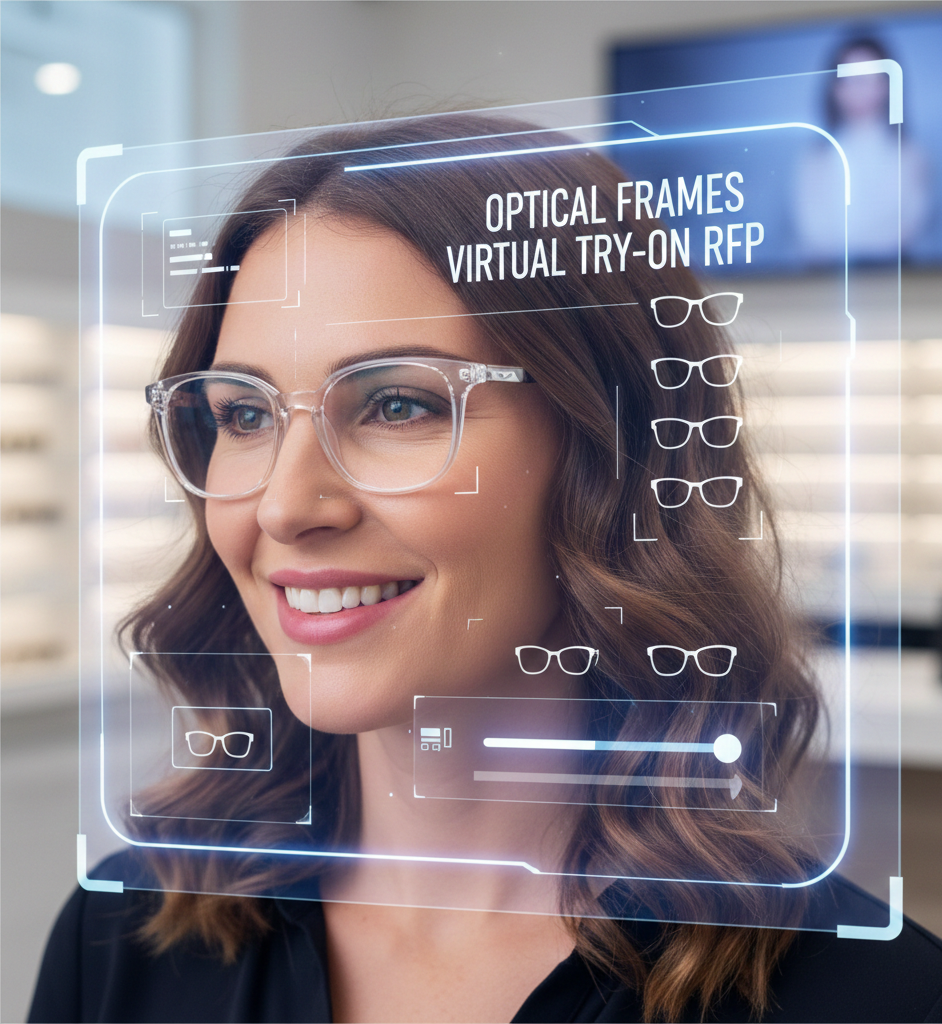
2D vs 3D Try On Optical Frames: Which VTO Approach Should Your Brand Pick?
Quick Summary
- 2D compositing: fast, low cost per SKU, and broadly compatible — ideal for pilots and social campaigns.
- 3D model-based VTO: high realism, better fit accuracy, suitable for premium products and in-store experiences.
- Hybrid strategy: start with 2D for validation, then upgrade hero SKUs to 3D based on data.
- Performance & fallback matters: serve 3D on capable devices, fallback to 2D on low-end devices.
What is 2d try on?
A 2d try on overlays a flat product image (or a set of layered images) onto a user’s selfie or camera stream by detecting facial landmarks—eyes, nose bridge, cheekbones—and positioning the overlay accordingly. The underlying face detection and compositing techniques are well established (see face landmarking and compositing basics).
Because 2D assets are lightweight, they often load quickly and work well across many devices when combined with web performance best practices.
Strengths and typical use-case summary
- Fast to implement and iterate
- Lower production cost than full 3D modeling
- Lightweight on bandwidth and device resources
- Scales well for large catalogs and frequent SKU updates
Limitations to be aware of
- Less accurate for head rotation and profile views
- Can struggle with realistic shading and dynamic lighting
- Fit judgments (bridge depth, temple arm position) are approximate — see frame-fit try-on guide
- UX edge cases when users move quickly or tilt their head

Why many brands start here
- Rapid rollout: functional experience with fewer assets and less lead time.
- Broad compatibility: works on older phones and browsers more reliably than heavy 3D scenes.
- Cost-efficiency: no need for full 3D modeling for every SKU.
- Good for marketing channels: ideal for social ads, email, and shoppable posts (see examples of lightweight AR retail use cases: Shopify AR retail use cases).
When 2D shows its limits
- Rotation and perspective: a single flat overlay cannot reproduce realistic parallax or profile views.
- Lighting and shading: static overlays won’t react to ambient light, making appearance less photorealistic — see eyewear reflection & try-on.
- Fit precision: shoppers who care about bridge fit or temple arm length may be unconvinced.
- Edge-case UX: rapid head movement can expose overlay seams or alignment issues.
(If you need highly accurate fit assessment, 3D or hybrid solutions should be considered.)
What is 3d try on?
A 3d try on uses textured 3D models of frames combined with real-time rendering and head-pose/depth tracking so the eyewear behaves like a real object as the user moves. The web-side APIs and browser capabilities that enable this include WebXR and 3D/WebGL technologies (see WebXR overview and WebGL browser support).
Why brands choose 3D
- True perspective: frames rotate and occlude naturally with head movement.
- Improved fit cues: depth, temple placement, and side profiles are clearer.
- Richer AR experiences: supports higher-fidelity marketing and assisted selling use cases.
Strengths of 3D model-based try-on
- Higher realism that builds shopper confidence
- Better handling of rotation, lighting (with PBR/textures), and fit across angles — see eyewear reflection & try-on
- Strong ROI potential for premium or fit-sensitive SKUs and in-store AR activations (see AR for retail use cases: Snap AR for retail).
Limitations and costs of 3D
- Asset size and load time: 3D models, textures, and shaders increase payloads; follow web performance best practices to mitigate (web performance guide). See also mobile performance notes: mobile performance.
- Device and browser variability: older devices or restricted browsers may struggle with complex scenes (browser capability reference).
- Production timeline and cost: each SKU requires modeling, texturing, and QA; expect longer lead times and specialized resources.
Side-by-side comparison: 2d vs 3d try on optical frames
This quick-read comparison focuses on the practical criteria product, UX, and marketing teams care about when choosing between 2D and 3D.
- Realism
- 2D: Good for front-on previews
- 3D: Realistic across angles and motion
- Fit accuracy
- 2D: Approximate
- 3D: Higher fidelity for bridge, width, and temple fit
- Device compatibility
- 2D: Broad (mobile and desktop)
- 3D: Best on modern devices, may require fallbacks
- Implementation time
- 2D: Short
- 3D: Longer (asset creation + QA)
- Cost
- 2D: Lower per-SKU
- 3D: Higher per-SKU, but durable once produced
- Scalability
- 2D: Excellent for large catalogs
- 3D: Ideal for curated hero SKUs
- Analytics usefulness
- 2D: Great for engagement signals
- 3D: Better for deep evaluation and premium conversion measurement
Context note on device capacity: consider mobile/WebAR usage trends when prioritizing experiences—device capability varies across regions and user segments (overview: AR usage trends; browser capabilities: caniuse).
Quick decision checklist — when to pick 2D vs 3D
Choose 2D if:
- You need to launch quickly and test VTO demand.
- You have a large, frequently changing catalog.
- Your primary channels are social and mobile web with broad audience reach.
- You want to keep per-SKU costs low.
Choose 3D if:
- Your frames are premium or fit-sensitive.
- You want highest realism on product detail pages and in-store kiosks.
- You have traffic and budget to justify longer production timelines.
- You aim to reduce fit-related returns and support assisted selling.
Which is better — which is better 2d 3d try on?
Short verdict: it depends. The right choice aligns with your brand goals, budget, and audience devices.
Decision framework to use now
- Brand goals: prioritize realism (3D) vs. reach/speed (2D).
- Product type: premium/fit-sensitive (3D), mass-market/many SKUs (2D).
- Budget & time: larger budgets and lead time enable 3D.
- Channels: social and paid ads favor 2D links; product pages and in-store kiosks favor 3D.
- Analytics readiness: can you measure and act on engagement signals?
Concrete scenarios
- New, high-volume collection launch: start with 2D to validate demand quickly.
- Luxury optical line: invest in 3D to improve conversion and reduce returns.
- Omnichannel campaign: use link-based 2D for broad acquisition, 3D for product pages.
- Limited budget but high SKU count: prioritize 2D for coverage; later upgrade top sellers to 3D.
Performance, UX, and technical considerations
Latency and load times
- Optimize images, compress assets, and lazy-load non-essential resources (web performance guide).
- For 3D, consider model LODs, texture compression, and progressive loading (mobile performance notes).
Fallback and device detection
Serve 3D to capable devices and fallback to 2D for lower-capability browsers or slow networks.
Privacy and face data
- Be transparent about camera use and consent.
- Minimize storage of biometric data and follow regulatory guidance (FTC resource: FTC face recognition guidance).
Accessibility
- Provide non-camera alternatives: product photos, measurements, and accessible controls.
- Follow W3C accessibility standards: W3C accessibility guidelines.
Security and compliance checklist
- Explicit camera permission flow
- Short-lived session tokens if storing temporary data
- Clear privacy/opt-out instructions
Implementation paths & timelines
Fast path — zero-code 2D deployment
- What you need: standard product photos (front, front/angled), basic sizing metadata, and a landing link.
- Timeline: days to a few weeks depending on review cycles.
- Use case: pilots, social campaigns, catalog-wide coverage.
- Try it quickly: tryitonme demo and tryitonme.com.
Full path — 3D implementation
- What you need: 3D models (CAD or created from photos), texture maps, PBR materials (optional), QA across devices. See pricing/requirements: 3D implementation notes.
- Timeline: weeks to months per SKU set depending on complexity and volume.
- Use case: premium lines, high-conversion product pages, in-store experiences.
Hybrid path — start 2D, upgrade to 3D
Recommended playbook:
- Launch broad 2D pilot.
- Measure engagement and conversion by SKU.
- Upgrade top-performing or most fit-sensitive SKUs to 3D.
Asset checklist for hybrid:
- 2D: high-quality product photos, metadata, basic measurements.
- 3D: existing CAD, or photogrammetry/photo set + vendor 3D modeling. (see RFP checklist and try-on checklist).
Note: tryitonme’s onboarding typically follows a simple flow—purchase a package, send standard product photos, the team/AI handles AR processing, and you receive a ready-to-use try-on link for deployment (see tryitonme.com). Confirm specific SLA/timelines with your tryitonme contact (contact).
Measuring success & A/B testing
Run experiments to prove impact, not assumptions.
Testing ideas
- A/B test 2D vs 3D on product pages (split traffic).
- Test try-on link vs image ad on paid social to measure engagement lift.
- Compare device segments: mobile vs desktop.
KPIs to track
- Try-on click-through rate (CTR)
- Session length on product pages
- Add-to-cart and conversion rate
- Average order value
- Return rate and support tickets related to fit
Testing guidance and resources
- Use standard A/B testing best practices to size experiments and control variables (see Optimizely: A/B testing guide).
- Pilot window: 2–4 weeks is a reasonable starting point; longer if traffic is low.
- Segment by device and traffic source for richer insights. (analytics notes).
Case study / hypothetical rollout example for optical frames
Hypothetical rollout (realistic, practical example):
- Brand: mid-sized eyewear retailer with 300 SKUs.
- Step 1 (Week 0–2): Launch 2D link-based try-on across product pages and paid social.
- Step 2 (Week 2–6): Measure try-on CTR, add-to-cart lift, and AOV; identify top 20 SKUs by engagement and conversion.
- Step 3 (Week 6–14): Produce 3D assets for the top 20 SKUs and deploy 3D on product pages and in-store tablets.
- Outcome: Broader validation from 2D pilot; deeper conversion gains and better fit confidence on upgraded 3D SKUs. (example ROI notes).
Label any charts or mock analytics as “example” and avoid claiming published uplift without an external source.
Why tryitonme.com is the Right Fit for Your Business
If you want to pilot VTO quickly and without engineering lift, tryitonme.com is built for rapid, low-friction rollouts:
- Zero-code, link-based deployment — no SDK or heavy integration required (tryitonme.com).
- Fast setup for pilots — pilot-ready try-on link after you send product photos (confirm timelines with the team) (demo).
- Scales across web, mobile, and social channels with the same shareable link.
- Supports both 2D pilots and 3D upgrades so you can test before you invest.
- Team + AI processing to reduce production overhead (contact).
Book a Demo — see how a no-code try-on pilot can fit into your roadmap: https://tryitonme.com/demo
FAQs
Q: Which is better 2d 3d try on for optical frames?
A: Neither is universally better. Start with 2D for speed and catalog coverage; choose 3D for premium, fit-sensitive SKUs or when realism is a priority.
Q: Are 2D try on results accurate?
A: 2D gives a reliable style preview (color, shape, general placement) but is limited for precise fit judgments like bridge depth and temple arm positioning.
Q: Do I need 3D assets?
A: Not for every SKU. Use 3D assets for hero products, premium lines, or where fit confidence directly impacts conversion and returns.
Q: How fast can I deploy a try-on link?
A: With a link-based, zero-code provider like tryitonme.com, you can often pilot much faster than with custom SDK or API builds—confirm specific timelines and onboarding steps with your tryitonme contact (contact).
Q: Can I A/B test 2D vs 3D?
A: Yes—A/B testing on product pages or by traffic source/device segment is the recommended way to quantify impact. Use standard testing frameworks and a 2–4 week pilot window as a starting point (A/B testing guide).
Conclusion & next steps
- Recommended path: launch broad with 2D; measure engagement; upgrade top-performing or fit-sensitive SKUs to 3D.
- Performance tip: use device detection and serve 3D only where it performs well; default to 2D otherwise.
- Risk mitigation: run A/B tests (2–4 weeks) and track try-on CTR, add-to-cart, conversion, and returns.
- Move quickly: if you want a low-friction pilot, tryitonme.com demo offers link-based, zero-code try-on options to validate demand before deeper 3D investment.
Primary CTA: Book a Demo with tryitonme.com
Secondary CTA: Request pilot or contact the team
If you’d like, I can convert this into a CMS-ready version with H2/H3 markup and image captions (including suggested alt text and transcripts for video), or build a short checklist PDF for your product team to use during a VTO pilot. Which would help most next?