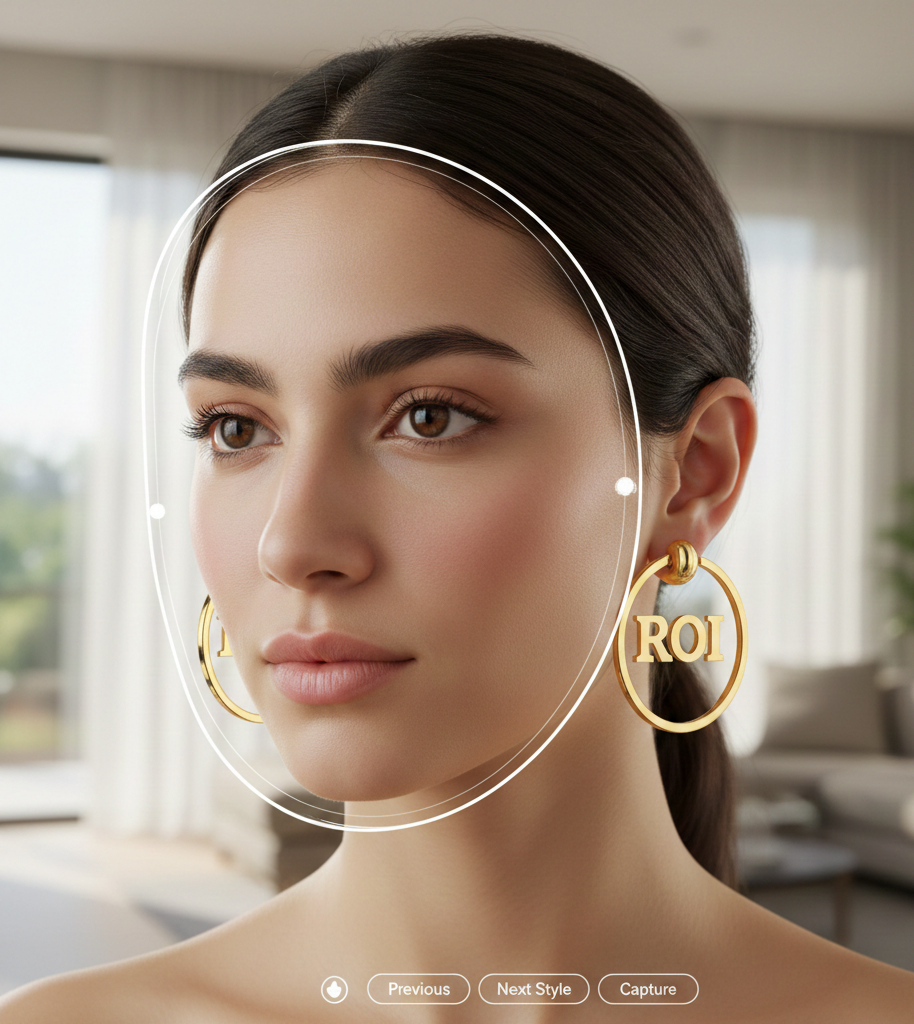
ROI Hoop Earrings Virtual Try On — How Link-Based VTO Boosts Conversion, AOV & Cuts Returns
Quick Summary
- Link-based, zero-code VTO is a fast pilot with measurable KPIs: try-on engagement, conversion, AOV and returns.
- Industry benchmarks (Perfect Corp, Fashionbi, Mirrar) show typical conversion and returns improvements you can expect.
- A simple 10k-visitor worked example shows meaningful net gains after VTO cost; use the provided ROI formula.
- Deploy with minimal dev work—place links on PDP, email, social; measure with vto_* events in GA4.
Introduction — What you’ll learn and the quick promise
roi hoop earrings virtual try on is an easy, measurable test you can run that often produces meaningful gains in conversion, average order value (AOV) and returns reduction. In this post you’ll learn which KPIs to track, realistic uplift ranges based on industry data, a worked example you can adapt, and a step‑by‑step 30–60 day pilot you can run using a zero‑code, link‑based VTO from tryitonme.com.
You’ll see evidence-backed benchmark ranges from AR industry reports (for example Perfect Corp’s VTO benefits overview and Fashionbi’s AR and jewelry impact summary), a simple worked ROI example for a 10k‑visitor scenario, and an implementation playbook so you can test quickly with minimal dev effort.
Why accessories — especially hoop earrings — benefit from virtual try-on
Try-on friction for hoop earrings is real: scale looks different on every face, photos on model shots under different lighting don’t translate to a customer’s selfie, and shoppers can’t judge proportion or style without seeing hoops on their own face. Those uncertainties drive hesitation, cart abandonment and returns.
Virtual try-on gives customers a realistic preview of scale and style on their own face, eliminating guesswork and recreating an in-store try-on experience online. Industry writeups explain why jewelry VTO addresses those frictions and the UX patterns that help earrings specifically — see Perfect Corp and Glamar’s earring VTO UX notes. Short example: a “small hoops” product photo can look large on a petite customer; letting that customer preview the hoops on their selfie removes doubt and speeds the purchase decision.
What “virtual try on ROI” means for your business (KPIs to track)
virtual try on roi is simple to define and measure when you pick the right KPIs. At minimum, capture:
- Try-on engagement rate (clicks or starts / link exposures).
- Try on conversion rate (purchases from users who used the VTO — tries→purchase).
- Overall site or PDP conversion lift (control vs VTO).
- AOV uplift (changes in basket size when VTO is available).
- Returns rate (pre vs post; dollars saved from fewer returns).
- CAC and LTV (to check long‑term payback).
A working ROI formula you can use:
Incremental revenue (Δconversions × AOV) + Returns savings − VTO cost = Net ROI.
For measurement context and traffic‑centric attribution practices, see Tangiblee and Fashionbi for AR KPI framing.
Realistic benchmarks & expected uplifts (conservative → aggressive ranges)
Use these industry ranges to set expectations; the ranges below are drawn from AR/VTO industry reporting and jewelry pilots (see Perfect Corp, Fashionbi and Mirrar).
- Try-on engagement (clicks to open): conservative 10–25%, base 25–40%, aggressive 40–70%.
- Try on conversion rate (purchases from users who tried): conservative +30–50%, aggressive +66–94% (relative lift among triers).
- Overall PDP/site conversion uplift: conservative +20–40%, aggressive +50–94%.
- AOV uplift: conservative +10–20%, aggressive +25–40%.
- Returns reduction: conservative −20–35%, aggressive −35–40%.
Worked example (monthly, 10,000 visitors to a hoop PDP)
Assumptions (sourced/consistent with industry examples):
- Baseline conversion = 2% (200 orders)
- Baseline AOV = $100
- Baseline return rate = 15%
- VTO post-conversion rate = 3.2% (60% relative lift)
- AOV post = $120 (+20%)
- Return rate post = 9% (−40% relative)
- VTO cost = $500/month (pilot example)
Calculations:
- Incremental orders = (3.2% − 2%) × 10,000 = 120 extra orders.
- Incremental revenue = 120 × $120 = $14,400.
- Returns savings = (pre orders × baseline return rate × cost per return) − (post orders × post return rate × cost per return). Using cost per return = $30 (industry proxy): savings ≈ $300.
- Net gain = $14,400 + $300 − $500 = $14,200/mo.
Note assumptions above and see Perfect Corp / Fashionbi for reported lift ranges.
How try-on reduces returns for hoops and other accessories
returns reduction try on happens because VTO reduces the “doesn’t look right” and “too big/small” returns. Jewelry AR pilots and industry analysis report return reductions in the 20–40% range for similar categories — see Fashionbi and Glamar.
Operational math you can copy:
Return savings = Baseline orders × Baseline return rate × cost per return × % reduction.
Example (one-liner): 200 baseline orders × 15% return rate × $30 cost × 40% reduction = $360 savings.
Boosting try-on conversion rate — UX & placement best practices
Placement and microcopy determine whether a link-based VTO gets used. Place the try-on link where buyers expect it and remove friction.
Optimal placements and CTAs (quick list)
- Product detail page (primary).
- Quick‑view / PDP popover.
- Cart / mini-cart (“Try before you buy” reminder).
- Email/SMS product drop or cart‑reminder messages.
- Paid social and influencer posts (shareable link).
See placement guidance at Mirrar and Glamar.
CTA microcopy examples (three)
- “Try on now — see hoops on your face”
- “See how these hoops look on you”
- “Try this style on (selfie preview)”
Interaction design tips (small patterns you can implement quickly)
- Thumbnail “Try On” badge on the PDP image that opens the link.
- Selfie vs model toggle so users can switch views.
- Before/after toggle or snapshot export to save/share the look.
- Simple scale slider (small / medium / large) when your product photos include size references.
These small UX patterns increase try on conversion rate and are easy to combine with link-based VTO because no SDK is required.
Why tryitonme.com is the Right Fit for Your Business
- Accuracy for accessories: accessory‑focused AR processing tuned for earrings, watches, eyewear.
- Speed: Ready-to-use links delivered in under 3 business days after onboarding.
- Easy integration: ZERO‑CODE, link‑based deployment — no SDK or backend integration required (works across web, mobile, social). See details.
- Low friction onboarding: Purchase a 6‑month package → send standard product photos (front/side for earrings) → tryitonme.com handles AR processing → receive the unique, ready‑to‑use try‑on link in under 3 business days. Visit tryitonme.com for demo and link generation.
Implementation playbook — step‑by‑step pilot (30–60 day plan)
Pre-launch measurements (baseline)
- Capture at least 30 days of: PDP visits, conversions, AOV, returns, email/SMS conversion metrics. Tools: GA4, Shopify events, server logs.
- Guidance on traffic attribution and ROI with existing traffic: Tangiblee.
Quick pilot (setup with tryitonme.com)
- Pick 1–2 high‑traffic hoop SKUs.
- Purchase the 6‑month package and send standard photos. Reference: pricing & steps.
- Receive product try-on links in under 3 business days (per onboarding steps).
- Deploy links to the PDP and one promotional channel (email or paid social). See tryitonme.com.
A/B test & rollout criteria
- Use a 50/50 split: control (no VTO) vs treatment (VTO link).
- Test duration: >=30 days to smooth weekly patterns.
- Minimum sample: aim for statistically meaningful sample per your baseline conversion rate (see Tangiblee).
- Scale when you see ≥20% overall conversion uplift or positive payback within your acceptable window.
How to measure and attribute ROI (analytics & attribution)
Event naming (copy/paste ready):
- vto_link_click (user clicked try-on link)
- vto_start (session started)
- vto_add_to_cart (added after try-on)
- vto_purchase (purchase after try-on)
GA4 mapping: create events and set goals for vto_add_to_cart and vto_purchase; compare control vs treatment for conversion lift. Use holdout groups for clean attribution and uplift modeling (see Fashionbi and Tangiblee).
Simple ROI formula snippets:
- Net revenue per visitor = (orders / visitors) × AOV − VTO cost / visitors.
- Payback period = VTO cost / incremental monthly net revenue.
Case study / example scenarios (hypothetical)
Hypothetical “Hoop Brand X” (based on industry ranges): Baseline: 15k visitors, 2.5% conv, $110 AOV, 18% returns. Post-VTO: overall conv +52% → 3.8%; AOV +22% → $134; returns −38% → 11%. Result: ~$22k monthly incremental revenue + ~$1.2k returns savings − $500 cost = $22.7k net. Label assumptions clearly and vary inputs to test sensitivity. See industry context at Perfect Corp and Fashionbi.
Creative & merchandising tactics to increase AOV with VTO
- Post-try-on bundles: “Try + save” bundle suggestions after a successful try.
- “Complete the look” cross-sells (matching studs, necklaces).
- Limited-time bundle discounts triggered after a try session.
- Personalization rules based on detected face size (recommend hoop sizes).
For merchandising tactics tied to traffic and personalization, see Tangiblee.
Common objections & concise answers
- Is it accurate? Modern face‑tracking and accessory overlay are tuned for scale and placement — see Mirrar for industry context.
- What about privacy? tryitonme.com processes product overlays and delivers shareable links; onboarding is zero‑code and sessions are designed to avoid long‑term storage — see tryitonme.com.
- How much dev work? Zero — link-based deployment requires no SDK or backend integration.
- What does it cost? Onboarding is by 6‑month package—contact sales at tryitonme.com for pricing and scope.
CTA & next steps — run a 30‑day pilot (checklist & timeline)
Ready to test roi hoop earrings virtual try on? Here’s a 7‑item pilot checklist:
- Owners: Product manager + e‑comm merch + analytics lead.
- Timeline: Day 0 purchase → Day 1 send photos → Day 1–3 receive links → Day 4 deploy to PDP + one channel.
- Metrics: baseline conversion, AOV, returns, vto_link_click, vto_purchase.
- A/B design: 50/50 split on PDPs.
- Traffic target: sample size to reach statistical power (work with analytics).
- Creative: CTA microcopy and thumbnail assets.
- Review: 30 and 60‑day check-ins for scale decision.
Generate your product link or request a demo at tryitonme.com.
FAQ
Is the VTO accurate enough for jewelry like hoops?
Yes — modern accessory‑focused AR engines tune overlay scale and placement for earrings; see Mirrar’s overview for similar jewelry applications: Mirrar earring try-on.
What about user privacy and data storage?
Link-based sessions are typically transient. tryitonme.com processes overlays and provides shareable links; onboarding is zero‑code and sessions are designed to avoid long‑term storage — see tryitonme.com for privacy notes.
How much developer work is required?
None for basic deployment. Link-based VTO requires placing links or badges on PDPs, emails or social posts — no SDK or backend integration needed.
What are realistic uplift expectations?
Benchmarks vary, but industry reports show try-on engagement often 25–40% (base) and conversion lifts that can range from +20% overall to much higher among users who try. See Perfect Corp and Fashionbi for ranges: Perfect Corp, Fashionbi.
What does a pilot typically cost and how fast can we go live?
Pilot pricing is often sold as a multi-month package (example: 6‑month). tryitonme.com advertises link delivery in under 3 business days after onboarding — see onboarding steps and tryitonme.com for details.
Final recommended next step
Run a 30–60 day pilot to measure try on conversion rate, AOV uplift and returns reduction — generate your first zero‑code try-on link or request a demo at tryitonme.com.