ROI: Blue Light Glasses Virtual Try On — How Link-Based VTO Lifts Conversions, AOV & Cuts Returns
If you want to prove the ROI of blue light glasses virtual try on, this guide shows how a link-based VTO can lift conversions, raise average order value (AOV), and reduce returns — fast and with minimal dev work. For eyewear decision-makers, the business case is straightforward: VTO reduces shopper uncertainty and accelerates purchase decisions; tryitonme’s zero-code, shareable product links let you launch an experiment in days rather than months. Learn more about tryitonme eyewear VTO.
Quick Summary
- Link-based VTO reduces friction (no SDK/install) and can be deployed in days for fast experiments.
- Blue light glasses are high-intent but appearance-driven — ideal for VTO to boost try-on conversion rate.
- Track VTO impact with vto_opened / vto_used events, UTM parameters, and an order_vto_used flag.
- Typical benefits: higher conversion, increased AOV through cross-sell, and lower returns from appearance mismatches.
- Use the provided A/B test plan and conservative baselines to prove incremental ROI before scaling.
Why Blue Light Glasses Are Ideal for Virtual Try-On
Blue light glasses are a high-consideration, appearance-driven accessory where shoppers hesitate without seeing frames on their face. Market demand is rising — Allied Market Research details the growth of blue light-blocking glasses, confirming this is a volume category worth optimizing. Consumer data shows many shoppers have adopted virtual try-on for eyewear and report it helps decision-making; see findings from Mirrar on virtual eyewear try-ons. In short: blue light glasses = high intent + high uncertainty = ideal candidate for VTO to improve your try on conversion rate.
How Virtual Try-On Improves Conversion and Increases AOV
Define “Try On Conversion Rate”
Try on conversion rate = (number of users who use the VTO tool and subsequently purchase) / (number of unique users who had access to or clicked the VTO). Track this per SKU, campaign, or traffic source to quantify VTO impact. See conversion uplift examples from Fielmann’s case study with FittingBox.
UX & Marketing Flows that Convert Customers
Low friction is the conversion multiplier. Link-based VTO removes the friction of installs or SDKs and supports plug-and-play UX/marketing patterns:
- PDP placement: “Try On” CTA above the fold and inside the image gallery.
- Inline previews: open the link without leaving product context.
- Paid ads & social: use “See it on Me” CTAs linking directly to the VTO experience.
- Emails & SMS: include personalized VTO links in abandon cart and browse-abandon flows.
- Cross-sell & bundles: show complementary accessories and offer bundle discounts to VTO users to raise AOV.
AR/3D reporting shows higher conversion when shoppers interact with virtual try-on experiences — see analysis from Auglio. Tactically, combine VTO with cross-sell messaging to boost AOV.
Measuring Virtual Try-On ROI
KPIs to track
- Overall conversion rate
- Try on conversion rate (VTO users → purchase)
- AOV (overall and for VTO purchasers)
- Return rate (by reason code)
- CLTV, CAC, and ROAS for campaigns using VTO links
Simple ROI formula
Incremental Revenue = (Visits × ΔConversion × AOVafter) − (Visits × BaselineConversion × AOVbefore)
Net ROI = Incremental Revenue − VTO Cost
Benchmarks and attribution
Industry reporting suggests meaningful uplifts for eyewear VTO; see benchmark context from Digital Commerce 360. Instrument UTM parameters and a vto_used flag so orders can be attributed cleanly to the experience.
Returns Reduction — The Hidden Savings
Fit and appearance are leading reasons for eyewear returns. Auglio reports that “looked different in person” is a common return reason and that realistic previews reduce this friction (Auglio). Digital Commerce 360 also covers returns impact from VTO adoption (Digital Commerce 360).
Illustrative math: If returns drop from 25% to 15% and each return costs $10, every 1,000 orders can yield substantial savings. Track returns by reason code and compare cohorts (VTO users vs non-users).
Real-World Test Plan — A/B Test to Prove Value
Experiment design (prescriptive):
- Randomize visitors into Control (standard PDP) and Treatment (PDP with tryitonme.com VTO link).
- Primary metric: overall conversion rate. Secondary: try on conversion rate, AOV, return rate.
- Minimum duration: 2–4 weeks (longer for low traffic). Use a sample size calculator to set targets.
- Instrumentation checklist:
- UTM parameters on all VTO links
- Analytics events: vto_opened, vto_used
- Order flags: order_vto_used = true/false
- Return reason tagging for post-purchase analysis
- Interpretation: require statistical significance (p < 0.05) for primary metric; evaluate secondary metrics for supporting evidence.
Note: adapt these testing best practices to your traffic patterns and variance.
Why tryitonme.com is the Right Fit for Your Business
Why choose tryitonme.com:
- Accuracy: accessory-focused VTO tuned for eyewear, jewelry, watches, and hats. tryitonme eyewear VTO
- Speed: zero-code, link-based deployment — generate a shareable link in under 3 business days.
- Ease of integration: no SDK or API; add links to any web, mobile, social, or email channel.
- Scalable analytics: built-in events and attribution-ready links.
Implementation Steps with tryitonme.com
5-step implementation checklist:
- Create product in dashboard and upload standard assets (front + side photos for eyewear). Frame fit guide
- Generate a shareable VTO product link.
- Add the link to PDPs, paid ads, social posts, emails, SMS, and packaging QR codes.
- Run the A/B test (see Test Plan) and monitor events.
- Scale VTO to additional accessories after proving impact.
Asset tips: provide clean, high-contrast front and side images for accurate AR processing.
Best Practices to Maximize Uplift & Returns Reduction
UX & CRO recommendations
- Put the Try On CTA above the fold and in the product gallery.
- Use concise microcopy: “See how these look on you” or “Try them on in seconds.”
- Offer face-shape guidance and size guidance near the CTA. Frame fit guide
- Pre-select popular color/size to shorten time-to-try.
Marketing & distribution recommendations
- Run VTO links in paid creative with “See it on me” CTAs.
- Add links to abandoned cart emails and SMS flows.
- Use influencer posts with direct VTO links for shoppable social.
- Include QR codes in packaging and retail displays that open the VTO link.
Example ROI Calculation
Illustrative example (numbers labeled illustrative):
| Metric | Before VTO | After VTO (est.) | Difference |
|---|---|---|---|
| Conversion rate | 2.0% | 2.6% | +0.6% (30% lift) |
| AOV | $80 | $88 | +$8 (10% lift) |
| Return rate (fit/appearance) | 25% | 15% | –10% (40% reduction) |
| Revenue per 1,000 visits | $1,600 | $2,288 | +$688 (43% uplift) |
Use this template and plug in your baseline metrics to forecast incremental revenue and payback. Benchmark sources: Digital Commerce 360 and FittingBox Fielmann case study.
Measurement & Analytics Plan
Tracking checklist:
- UTM tagging for each VTO placement (channel, campaign, creative).
- Emit analytics events: vto_opened (click), vto_used (completed try-on session).
- Flag orders with order_vto_used = true when purchase follows VTO.
- Cohort analysis at 30/60/90 days comparing VTO vs non-VTO users.
- Attribution: assign ad ROAS to the VTO click that preceded the purchase; consider multi-touch models for assisted conversions.
- Statistical testing: predefine sample sizes, confidence levels, and minimum detectable effect.
Marketing Assets & Visuals to Include in the Post
Required visuals for the publish package:
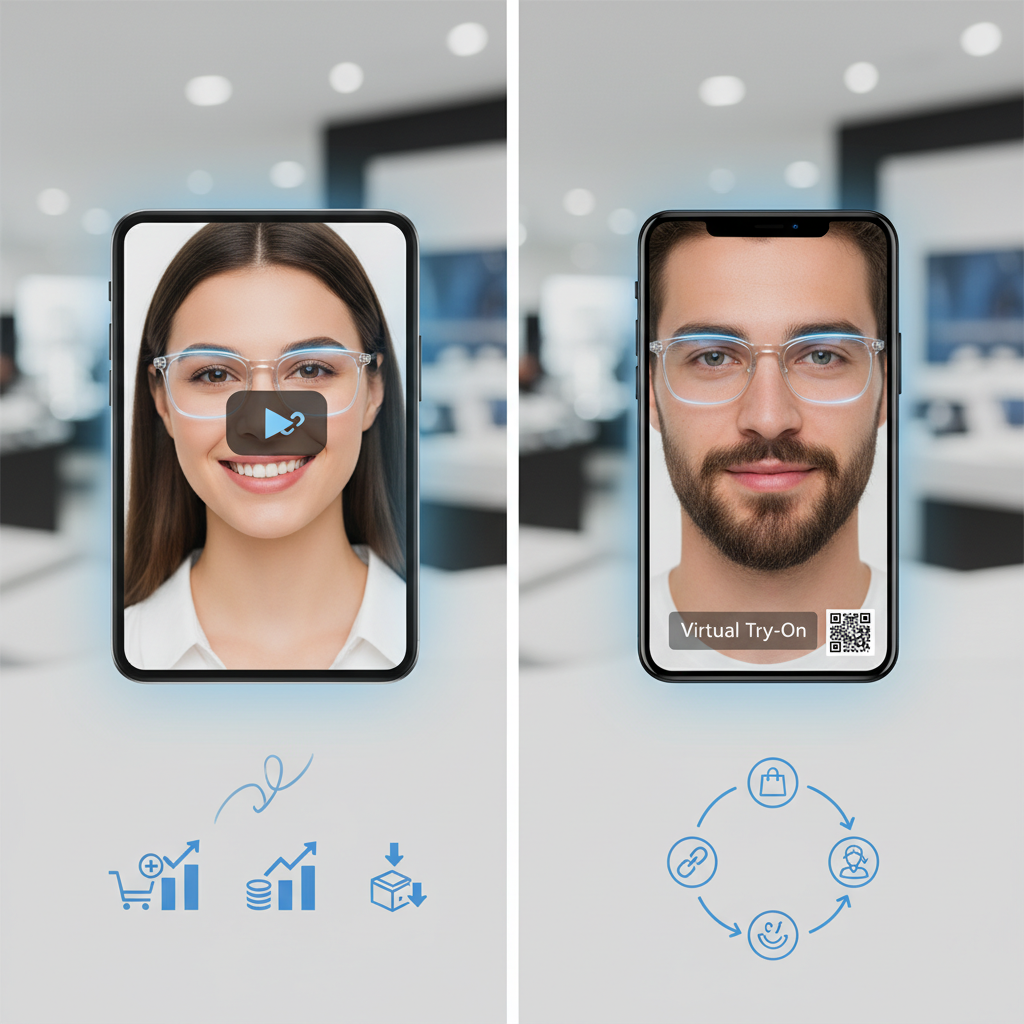
 Demo GIF of the tryitonme.com link-based VTO on a blue light glasses SKU (Alt text: “Blue light glasses virtual try on demo — tryitonme.com”).
- Conversion-lift chart mockup (Alt text: “Conversion uplift from virtual try-on”).
- Before/after screenshots of PDP with and without VTO (Alt text: “PDP with link-based VTO for blue light glasses”).
- Downloadable ROI calculator spreadsheet and A/B test checklist (include the primary keyword once in the alt text or filename).
 Demo GIF of the tryitonme.com link-based VTO on a blue light glasses SKU (Alt text: “Blue light glasses virtual try on demo — tryitonme.com”).
 Conversion-lift chart mockup (Alt text: “Conversion uplift from virtual try-on”).
 Before/after screenshots of PDP with and without VTO (Alt text: “PDP with link-based VTO for blue light glasses”).
Case Study Template & Social Proof Ideas
Short case study structure:
- Baseline metrics (conversion, AOV, returns).
- Launch approach (channels, timing, assets).
- 30/60/90-day results (percent lifts).
- Customer quote prompts: “What changed for your business?” and “How did VTO impact returns?”
- Visuals: before/after screenshots, demo GIF, conversion graph.
Reference the FittingBox Fielmann case study as an example: FittingBox case study.
Risk Notes & How to Mitigate
- Inflated expectations: use conservative baseline scenarios and pilot tests.
- Attribution leakage: enforce strict UTM discipline and event tagging.
- Creative quality: ensure clean product photos; poor assets reduce VTO accuracy.
- Privacy concerns: provide clear opt-in language for any photo uploads.
Next Steps & CTA
Ready to test the ROI of blue light glasses virtual try on for your store?
- Request a demo at tryitonme.com
- Start a free pilot (contact via the demo page)
- Download the ROI calculator and A/B test checklist from the publish package.
Remember: zero-code, link-based VTO can be live for testing in under 3 business days once you provide assets.
SEO & On-Page Optimization Checklist
- Primary keyword in H1 and first 50–100 words.
- Secondary keywords in relevant H2s.
- Use Article and Product schema; include alt text containing the primary keyword once.
- Internal links to tryitonme features, pricing, and demo pages: features, pricing.
- CTAs: Request a demo, Start a pilot, Download ROI tools.
Deliverables & Timeline for Publication
Required deliverables:
- 1,200–1,800 word article (this draft)
- Demo GIF + conversion chart
- Downloadable ROI calculator and A/B checklist
Production timeline (suggested): outline 1–2 days, draft + visuals 3–4 days, review 1–2 days, publish within 7–10 days.
Suggested Follow-up Content & Promotion Plan
- A/B test worksheet and traffic calculator.
- Deep-dive on returns reduction with real cohort examples.
- Webinar + live demo showing conversion uplift and analytics setup.
- Email nurture sequence converting demos to pilots.
Closing
Virtual try-on for blue light glasses is a measurable lever to lift conversion, increase AOV, and reduce returns. With tryitonme.com’s link-based, zero-code approach you can test quickly, measure cleanly, and scale what works — often within days. Ready to see the numbers for your catalog? Book a Demo.
FAQ
1. What is link-based VTO and how is it different from an SDK?
Link-based VTO provides a try-on experience via a shareable URL without the need to install an SDK or modify a large codebase—simply add the link to a PDP, ad, email, or QR code.
2. How quickly can I launch VTO using tryitonme.com?
With tryitonme.com, after you submit your assets (front and side photos), you can receive a ready-to-use try-on link in approximately 3 business days. See onboarding details: pricing & onboarding.
3. What measurement methods are most important for VTO ROI?
Prioritize overall conversion rate, try-on conversion rate (vto users → purchase), AOV, return rate by reason, and campaign-level ROAS. Use the vto_opened / vto_used events and order_vto_used flags for net attribution.
4. Does VTO actually reduce returns?
Industry cases show a reduction in look/fit-related returns when customers receive a realistic preview; see the discussion of returns in Auglio and Digital Commerce 360.
5. How do I ensure clean attribution for VTO sales?
Use UTM discipline, add vto_used analytics events, and set order_vto_used to true for orders that follow a VTO session. Consider multi-touch models for assisted conversions, but start with strict single-click attribution for experiments.