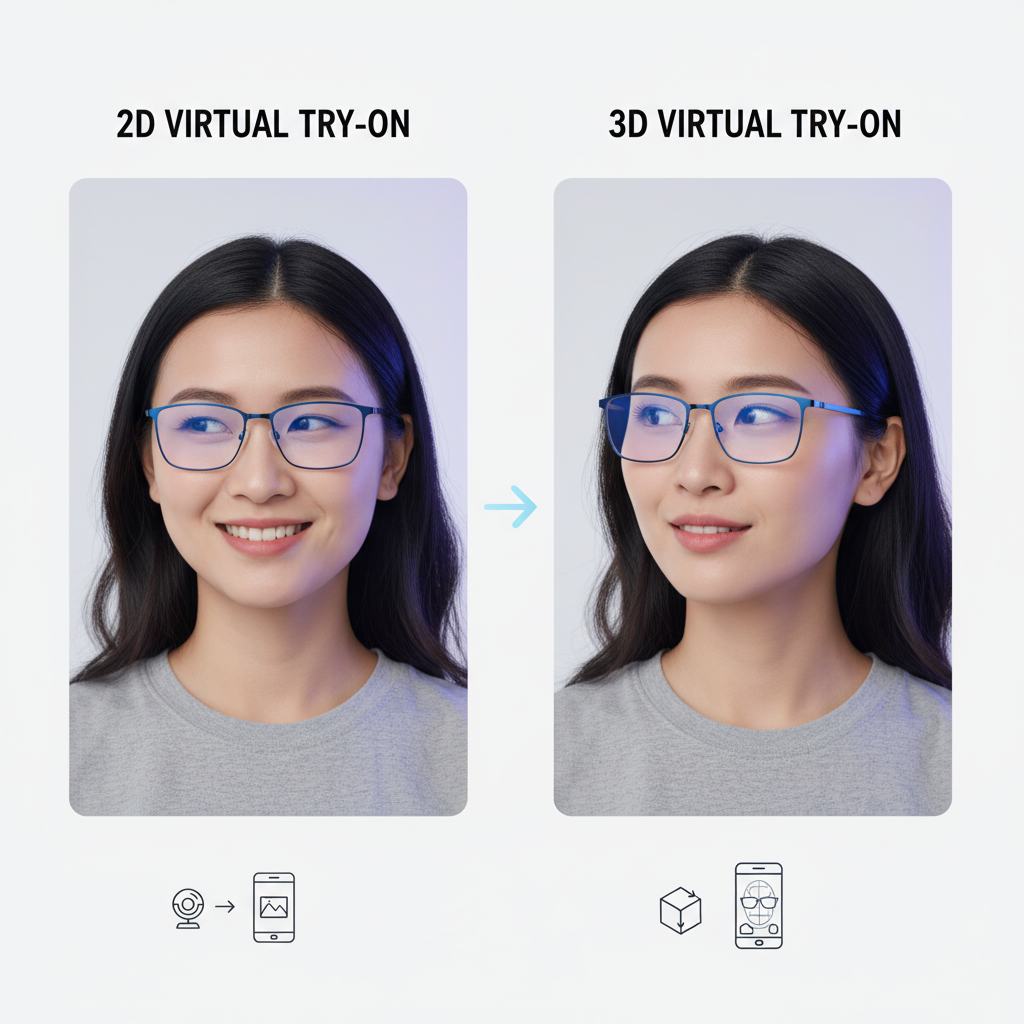
2d vs 3d Try On Blue Light Glasses: Which Should Your Store Choose?
Quick Summary
- 2D = fast, cheap, lightweight, and highly portable for links, ads, and emails.
- 3D = highest realism (occlusion, reflection, fit), but more expensive and performance-heavy.
- Hybrid strategy: roll out 2D quickly, then prioritize 3D for high-value SKUs.
- A/B test to decide based on conversion lift, AOV, and return rate.
Introduction — 2d vs 3d try on
You need a clear, practical way to decide whether 2D or 3D virtual try-on is the right fit for your blue light eyewear catalog. The choice affects speed-to-market, production cost, realism, and cross-channel deployment (web, mobile, social). This post compares 2D and 3D, explains trade-offs, and gives a decision framework so your team can answer: which is better depending on your priorities.
Why VTO matters for ecommerce (quick context)
Virtual try-on increases shopper confidence by letting customers preview eyewear on their faces remotely — important for reducing returns and improving conversion. For an industry overview, see Shopify’s AR/augmented reality guide. For focused ROI analysis on link-based VTO and conversion/return impacts, see this VTO ROI writeup.
What is 2D try on?
Short definition & how it works
2D try on uses image compositing: flat product photos or 2D renders are positioned over a user’s face image or camera feed using face detection and landmarking. The system aligns overlays (frames, shadows, tints) to facial keypoints so the glasses appear to sit on the nose and ears. For an example of the face-mesh/landmarking approach used in many 2D pipelines, see Google’s MediaPipe Face Mesh.
Typical implementation flow & tech requirements
- Assets: front (and sometimes side) product photos or 2D renders.
- Algorithm: face detection → landmark mapping → overlay compositing.
- Deployment: works in-browser, in-app webviews, and social platforms (see WebXR Device API context).
- Time-to-market: often days to a few weeks because asset needs are light and no 3D modelling is required.
Pros & Cons (business implications)
Pros
- Fast to produce and roll out across many SKUs.
- Low production cost — photos suffice; see pricing and packaging options.
- Lightweight: excellent load times and mobile performance.
- Excellent for channel portability (ads, email, web product pages).
Cons
- Limited depth and occlusion handling — can look “flat.”
- Less convincing for premium or complex frames.
- May not show accurate side profiles or reflections.
What is 3D try on?
Short definition & how it works
3D try on uses 3D models of frames, real-time rendering, and head/face tracking to render glasses with depth, occlusion, reflections, and perspective changes as the user moves. Models are commonly packaged in formats like glTF. For platform-level AR features see Google AR and Apple ARKit.
Typical implementation flow & tech requirements
- Asset creation: 3D modelling or photogrammetry/scanning into optimized glTF/GLB assets; procurement guidance: RFP and procurement playbook.
- Runtime: real-time rendering, lighting, and occlusion on device or in-browser WebAR.
- Performance: larger file sizes and GPU usage; optimization guidance like 8th Wall’s blog is useful.
Pros & Cons (business implications)
Pros
- Superior realism: depth, occlusion, reflections, accurate fit.
- Better for premium or prescription frames.
- Shows side views, temple fit, and subtle geometry.
Cons
- Higher production cost and longer lead times per SKU.
- Larger assets can hurt load times; need optimization.
- Device compatibility varies; fallbacks required.
Direct comparison — 2d try on vs 3d try on
Quick side-by-side decision matrix:
- Accuracy & Realism: 2D — moderate; 3D — high.
- Performance & Load Time: 2D — fast, lightweight; 3D — heavier, requires optimization (see web performance guidance).
- Production Cost & Speed: 2D — low cost, fast; 3D — higher cost, slower.
- Cross-Channel Portability: 2D — excellent; 3D — good but needs optimization for social/mobile.
- A/B Testing & Analytics: 2D — fast to test across many SKUs; 3D — testable but more setup.
Accessibility & fallback strategies
Design for progressive enhancement. Serve a 2D overlay or static photo when device capabilities or bandwidth are insufficient, and switch to 3D when supported. Follow accessibility best practices and AR fallbacks from W3C WAI.
When to choose 2D compositing (practical use cases)
Pick 2D when:
- Large SKU counts and need rapid catalog coverage.
- Budget or timeline is tight (seasonal launch or social ad campaign).
- Prioritize channel portability (ads, UGC, email) and low-friction sharing.
- Product price points are mass-market and immersive realism is not the main purchase driver.
Concrete example: a marketplace launching 200+ low-cost blue light frames can roll out 2D overlays to every SKU in days and attach shareable try-on links to social ads and product pages for immediate uplift.
When to choose 3D model‑based try‑on (practical use cases)
- Sell premium or prescription blue light frames where fit and perceived quality influence conversion; see the frame fit practical guide.
- Want high-fidelity experiences for showrooming, virtual appointments, or high-AOV products.
- Prepared to invest in longer-term content creation for top SKUs.
Hybrid approaches & progressive rollout
Recommended rollout pattern:
- Phase 1 (0–2 weeks): Launch 2D try on across your full catalog for immediate coverage and baseline metrics.
- Phase 2 (2–8 weeks): Identify top-performing or high-AOV SKUs.
- Phase 3 (8–20+ weeks): Build 3D models for the top X% of SKUs and A/B test them against the 2D baseline.
A/B testing strategy to discover “which is better 2d 3d try on”
- Split traffic evenly by SKU or visitor segment (Group A sees 2D; Group B sees 3D).
- KPIs: conversion lift, add-to-cart rate, session duration, return rate.
- Tools and reading: Optimizely’s A/B testing fundamentals; analytics setup reference: Google Analytics.
- Run tests until statistically significant or until you hit a pre-defined sample size.
Implementation considerations & timelines
Typical timelines & owner roles
- 2D try on: 3–10 business days per batch (creative/photography + AR processing); owners: creative lead + AR supplier; minimal engineering.
- 3D try on: 2–8+ weeks per SKU (3D modeling/scanning, optimization, testing); owners: product design, AR/3D vendor, engineering. See vendor checklist: Blue Light Glasses Try On Vendor Checklist.
- Hybrid: start 2D immediately, plan 3D backlog for prioritized SKUs.
Asset requirements and quality checklist
2D photo checklist:
- Front-facing high-resolution photo (neutral background).
- Side angle (optional).
- Clear product color/lens variations labeled.
3D model checklist (glTF/GLB best practices):
- Optimized polygon count and texture atlases.
- Accurate scale and origin.
- Separate materials for frames, lenses, metal/plastic parts. See glTF recommendations.
Measurement — metrics to track to answer “which is better 2d 3d try on”
Track these KPIs:
- Conversion rate (primary).
- Add-to-cart rates and checkout completion.
- Average order value (AOV).
- Return rate.
- Engagement: try-on sessions, dwell time, repeat uses.
For ecommerce analytics context see Shopify analytics and Google Analytics ecommerce guidance.
SEO & marketing angles for VTO (how to promote your try-on)
Link-based VTO advantages for social, email, and UGC
A shareable try-on link simplifies distribution: embed in paid social ads, include in marketing emails, and invite customers to share try-on UGC. Link-based deployment accelerates creative testing and improves CTR without heavy engineering.
Suggested on-page SEO & alt-text guidance
- Title/H1: include primary keyword (e.g., “2d vs 3d try on blue light glasses: Which is right for your store?”).
- Meta description template: “Compare 2D and 3D try-on for blue light glasses and find the fastest, most effective path for your catalog. Try a shareable demo from tryitonme.com.”
- Alt text examples: “2d try on example for blue light glasses”, “3d try on comparison of same blue light frame”.
Why tryitonme.com is the Right Fit for Your Business
tryitonme.com provides zero-code, link-based VTO for eyewear and accessories — no SDK or API integration needed. Key value props:
- Accuracy: tailored VTO for accessories with attention to fit and occlusion.
- Speed: get a ready-to-deploy try-on link in under 3 business days.
- Easy integration: shareable link works across web, mobile, and social — no engineering required.
- Simple onboarding: purchase a package, send standard product photos, tryitonme team/AI handles AR processing, receive unique try-on link.
Book a demo at tryitonme.com. For a broader platform overview see this writeup: tryitonme eyewear platform writeup.
Real-world example / mini case study (hypothetical)
Before: retailer with 300 blue light SKUs needed immediate try-on across channels. Action: launched 2D across the catalog, then created 3D models for the top 10% premium SKUs. Result: retailer reported noticeable conversion improvements among premium SKUs after moving to 3D, which justified the incremental cost. (Illustrative and hypothetical.)
Checklist & decision framework — which is better 2d 3d try on for your catalog
- If you need speed, wide SKU coverage, and low cost → choose 2D.
- If you sell premium frames where fit realism drives purchase → prioritize 3D.
- Low risk: start with 2D and add 3D for high-AOV or high-traffic SKUs (hybrid).
- If you must support social and email quickly → prefer link-based 2D deployment first.
Visual & interactive assets to include (editorial brief)
Required assets to support this article:
- Side-by-side GIF/video comparing 2D vs 3D on the same blue light frame (alt: “2d try on example for blue light glasses”).
- Comparison chart image summarizing pros/cons.
- Decision-tree infographic for “which is better 2d 3d try on”.
- Embedded tryitonme shareable demo link / CTA.
Conclusion & next steps (CTA)
Choosing between 2D vs 3D try on depends on priorities: speed and scale (2D) versus realism and fit accuracy (3D). The safest path: pilot — roll out 2D broadly, measure results, then selectively add 3D for SKUs that benefit most. Ready to try it? Book a demo and test link-based 2D and 3D try-on options at tryitonme.com.
Quick CTAs:
Book a Demo ·
Try live demo ·
Request A/B test plan
Appendix & deliverables checklist for publication
- Final ~1,200–1,800 word draft (this document).
- Comparison table image.
- Decision-tree infographic.
- 1–2 demo GIFs/videos (2D vs 3D).
- Meta title/meta description suggestions.
- 3 CTAs linked to tryitonme.com (Book a Demo; Try live demo; Request A/B test plan).
References and further reading
- Shopify — Augmented reality for ecommerce
- Google MediaPipe face mesh
- WebXR Device API (MDN)
- glTF format — Khronos Group
- Google AR developer docs
- Apple ARKit
- 8th Wall blog (WebAR performance)
- Web performance guidance (MDN)
- W3C WAI — Accessibility guidance
- Optimizely A/B testing basics
- Google Analytics ecommerce guidance
- tryitonme.com — demo and product info
- tryitonme eyewear platform writeup
- Frame Fit Try On guide
- Blue Light Glasses VTO pricing
- VTO ROI — link-based VTO
- Blue light glasses virtual RFP
- Vendor checklist
FAQ
1. Which delivers faster time-to-market: 2D or 3D?
2D is significantly faster: asset needs are minimal (photos/renders) and implementations can roll out in days to weeks. 3D requires modeling/scanning and optimization, so expect weeks per SKU.
2. Can I run 2D and 3D for the same SKU?
Yes — a hybrid approach is common: deploy 2D across the catalog, then prioritize 3D for top SKUs and A/B test to measure incremental impact.
3. Do I need special device support for 3D try-on?
3D is more demanding on GPU and browser/OS AR capabilities; plan fallbacks (serve 2D or static images) for low-end devices and use progressive enhancement.
4. How should I measure success when comparing 2D vs 3D?
Primary KPIs: conversion rate, add-to-cart, AOV, and return rate. Also track engagement metrics like try-on sessions and dwell time. Run A/B tests until statistically significant.
5. Are there cost benchmarks for 2D vs 3D?
Costs vary by vendor, quality, and SKU volume. In general, 2D is low-cost per SKU (photos + processing), while 3D carries higher per-SKU modeling/scanning and optimization costs. See pricing guidance: VTO pricing.
6. How do I start a pilot quickly?
Start with a 2D link-based try-on rollout for a representative subset of SKUs (or your full catalog for quick coverage), instrument analytics, then select top SKUs for 3D. For turnkey link-based options, visit tryitonme.com.